Advanced Diabetes Management(CGMS, INSULIN PUMP & AGP)
Without diabetes, your body tracks glucose levels all day and night to ensure the right amount of insulin is released at the right time. To successfully manage diabetes, a monitoring system is needed to consistently check your glucose levels.
We provide you CGMS, Insulin Pump & AGP systems which provide you real-time, dynamic glucose information in every two-three minutes to lead a happy lifestyle.
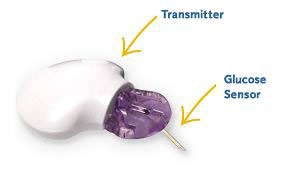
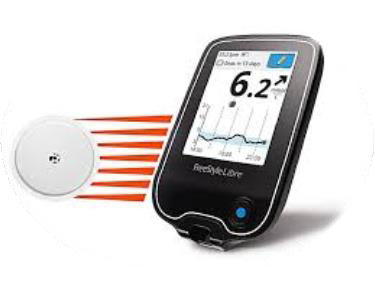
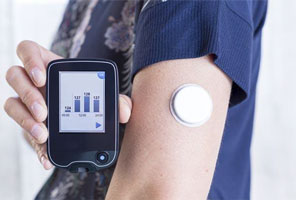
Continuous Glucose Monitoring System (CGMS)
- It is a device that records glucose level throughout day and night.
- It can provide measurements every 24 hours.
- System used to measure an average blood glucose for up to 3 days, while the person with diabetes continues daily activities at home and work.
- A tiny sterile flexible electrode inserted just under the skin and it measures glucose in interstitial fluid.
- Used for patient empowerment to lead and act upon continuous glucose information.
- It allows to view fluctuations during days and night.
- Provides insights that fingerstick testing and HbA1C can’t provide.
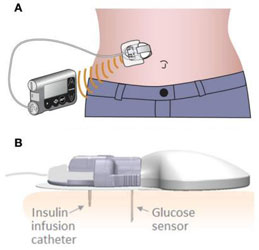
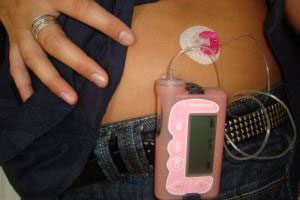
Insulin Pump
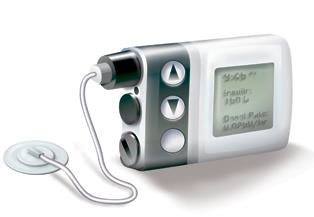
- It can closely mimic normal pancreatic insulin delivery.
- It infuses rapid acting insulin in precise programmable doses to meet individual patient needs.
- Delivers insulin through a soft cannula under through skin.
- Replaces injections.
Indications:
1. Patient’s with type 1 Diabetes Mellitus
2. Patient with type 2 Diabetes Mellitus on multiple tablets + insulin with HbA1C > 7%
3. GDM, Type 1/ type 2 during pregnancy or preconception requiring insulin therapy.
4. Patient’s with type 1/ type 2 diabetes mellitus with brittle diabetes, fluctuating blood sugars and repeated hypoglycaemia/ nocturnal hypoglycaemia.
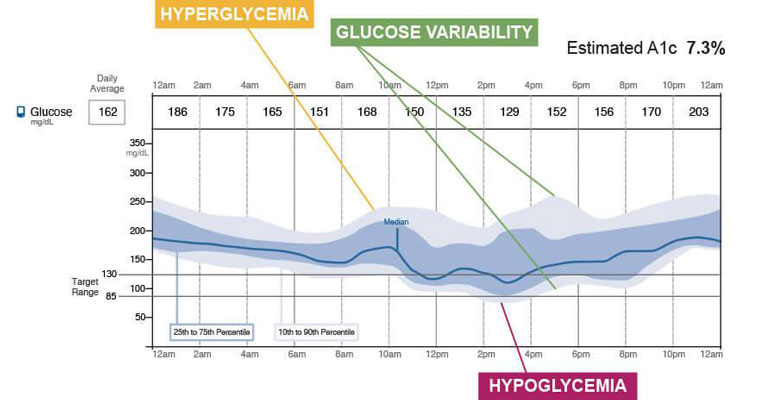
AGP (Ambulatory Glucose Profile)
1. AGP provides more data than Self-monitoring blood glucose (SMBG), making it easier to build comprehensive graphs that provide more information about glucose variability, hypo-and hyperglycaemia.
2. AGP is a visual report that collapses all glucose reading as if they occurred in a 24-hour period making it easier to visualize glycemia patterns.
3. The AGP graph provides a visual representation of glycemia targets, glucose variability, patterns of hypo-and hyperglycaemia.
4. The AGP graph provides the information that Health care providers (HCPs) need to assess and fine tune the therapy.
5.The AGP graph is a valuable tool that may enhance the communication and partnership between HCPs and their patients.
Three reports include:
1. Daily patterns (with Ambulatory Glucose Profile and with glucose traces.)
2.Glucose pattern Insights (with and without glucose reading)
3. Daily Glucose Summary
Steps to AGP Interpretation
1. Assess Target
2. Identify Degree of Variability
3. Risk of hypoglycaemia